Four years of running visualized with Leaflet and D3
In my previous blog post I wrote about small utility that exports workouts from popular Runmeter app to GeoJSON. Primary motivation was of course to have data in a format that is readable and can easily be visualized. For a long time I had this idea - wouldn’t it be great if there was one place where I could get overview of when and where in the world I did my runs?
Clustering the mess
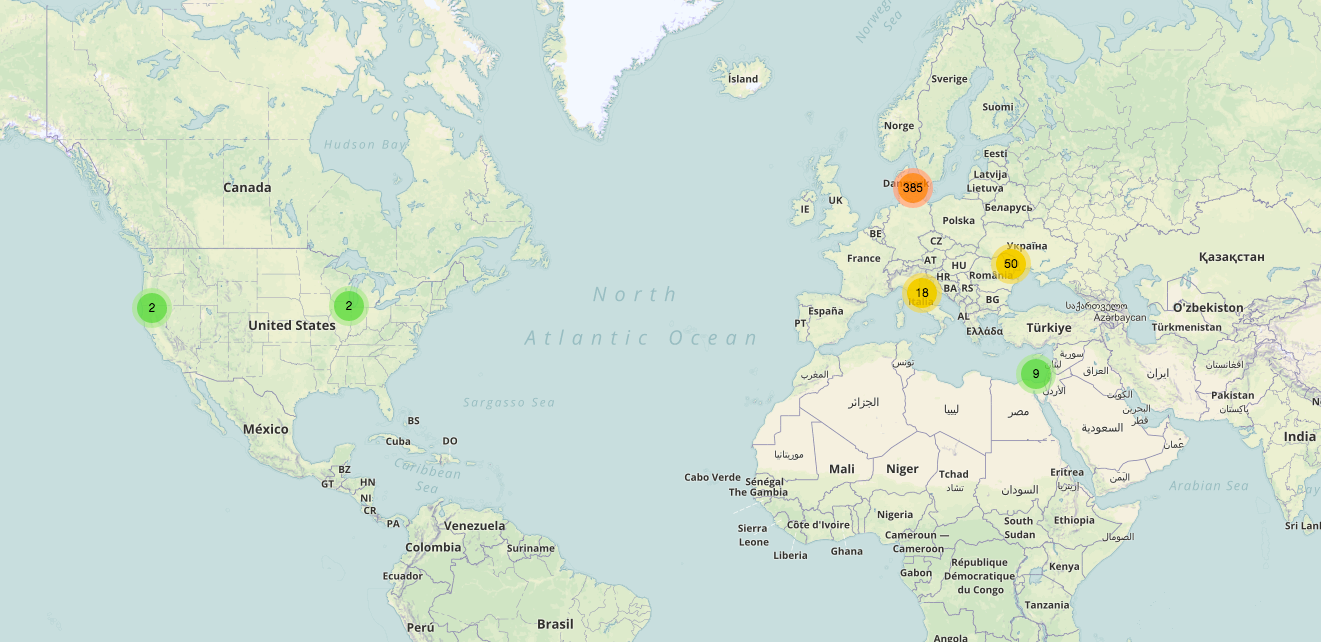
Since I started running about four years ago I did about 500 runs. Most of these runs were along the same routes and simply throwing them on the map would create a mess that is hard to grasp. Clustering turned out to be a perfect solution here. I created markers for starting points of each run and added them to the L.MarkerClusterGroup, which gave nice overview of where in the world I run most:
Decoding packed geometries
While GeoJSON is readable and easy to understand format, it is quite inefficient when it comes to storing bigger amounts of data. 500 runs, each with geometries of hundreds of points generated a 10MB file. To minimize page load time I compressed it with geojson-minifier utility that is supposed to be used for exact these scenarios. Minimized version turned out to be 5 times smaller which was a nice performance gain.
Geojson-minifier only stores first coordinate of each line in its original version. Then it only stores the difference of consecutive coordinates thus reducing number of characters in a file. Therefore to show start of each run I would only need to loop through all runs and create markers with first unencoded coordinate. When clicking on a marker to see the details I would decode geometry on demand to a valid GeoJSON geometry format that can be used by Leaflet:
var minifier = new GeojsonMinifier({ precision: 6 });
feature.geometry.coordinates = minifier.decodeGeometry(feature.geometry.coordinates);
Animate running path with D3
Simply throwing path on a map would be boring. Wouldn’t it be cool to animate drawing path as the dashboard counts up total running distance? Inspired by this blog post, I used d3 to draw an SVG overlay instead of using Leaflet’s GeoJSON layer. Animation is achieved by manipulation of stroke-dasharray attribute by gradually changing dash width and distance between the dash and the end of the path over time.
Feel free to play around with fullscreen demo and code on Github.