Taking mapbox-gl.js for a spin
Not long ago Mapbox announced release of mapbox-gl.js, a javascript mapping library based on WebGL. WebGL has been around for a while but hasn’t been widely adopted because of lack of support in major browsers. Now that all latest major browsers, including Internet Explorer, have support for it, it becomes more and more interesting. Even more exciting is the fact that WebGL is coming to mobile with newly released iOS8 adding support for it. Exciting times indeed! With all that in mind I couldn’t resist to try it out.
Starting off
Getting up and running is easy and documentation provides some good examples for that. With just a few lines of code you can get a working map:
mapboxgl.accessToken = '<your access token here>';
var map = new mapboxgl.Map({
  container: 'map', // container id
  style: 'https://www.mapbox.com/mapbox-gl-styles/styles/outdoors-v5.json', //stylesheet location
  center: [40, -74.50], // starting position
  zoom: 9 // starting zoom
});
As you can see, map is powered by stylesheet outdoors-v5.json where datasources and styles are specified. Openstreetmap data has quite complex structure with lots of layers in it. That makes it a bit hard to grasp concepts of mapbox-gl.js as stylesheet file is huge with over 2000 lines in it. A better way to start with new technology would be to start from scratch with data that is easy to understand.
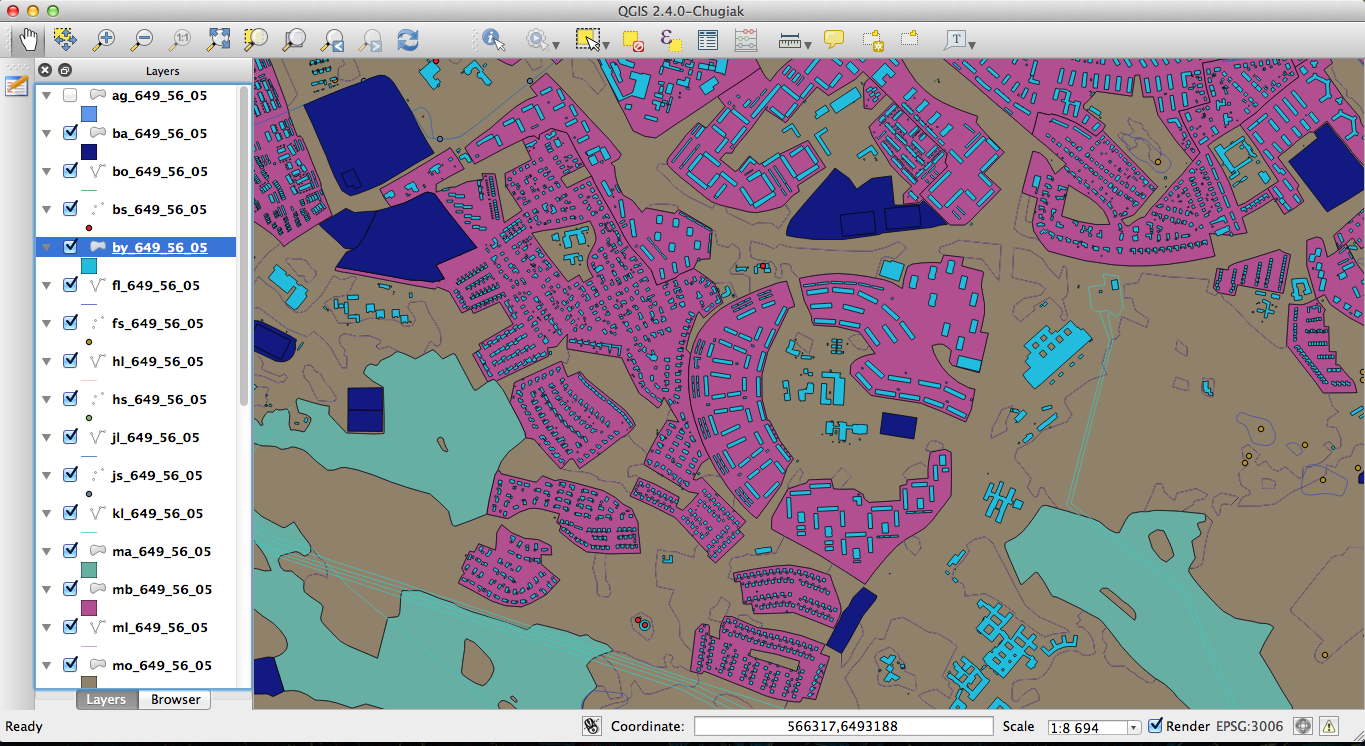
Let’s get some data from Swedish governmental mapping agency, Lantmäteriet. Demo data that they provide on their site has over 30 different layers with all kinds of information.

To keep things simple let’s pick 3 layers that we’ll use to create a background map: roads, buildings and parks. With some ogr2ogr magic we can easily transform shape files in Swedish sweref99 projection to geojson files in wgs84 that mapbox-gl.js can consume:
ogr2ogr -f "GeoJSON" -s_srs EPSG:3006 -t_srs EPSG:4326 buildings.geojson buildings.shpGeojson is one of the few formats that mapbox-gl.js supports as of now. It might not work so well if you want to create map for bigger area, as it will require you to download all the data in the browser before you can render it, which can take a while. A better approach would then be to use vector tiles so that client gets data in small chunks. For our demo though geojson will work just fine as the area is just a couple of square km.
Basic stylesheet
Now that we have data to play with, let’s create a basic stylesheet. The building blocks of a stylesheet are sources and layers. Sources describe where to get data and layers describe how to style it. Other options you can specify in a stylesheet are version, sprite, glyphs and constants. Let’s create stylesheet with bare minimum:
{
  "constants": {
    "@roads": "#ffffff",
    "@parks": "#C0D899",
    "@buildings": "#D3C0AE"
  },

  "sources": {
    "roads": {
      "type": "geojson",
      "data": "http://igortihonov.com/demo/mapbox-gl-js/roads.geojson"
    },
    "parks": {
      "type": "geojson",
      "data": "http://igortihonov.com/demo/mapbox-gl-js/parks.geojson"
    },
    "buildings": {
      "type": "geojson",
      "data": "http://igortihonov.com/demo/mapbox-gl-js/buildings.geojson"
    }
  },

  "layers": [
    {
      "id": "background",
      "style": { "background-color": "#EDEADE" },
      "type": "background"
    },
    {
      "id": "roads",
      "source": "roads",
      "style": {
        "line-color": "@roads",
        "line-width": 3
      },
      "type" : "line"
    },
    {
      "id": "parks",
      "source": "parks",
      "style": { "fill-color": "@parks" },
      "type": "fill"
    },
    {
      "id": "buildings",
      "source": "buildings",
      "style": { "fill-color": "@buildings", "fill-outline-color": "#dfdbd7" },
      "type": "fill",
      "interactive": true
    }
  ]
}
By slightly modifying earlier javascript code that creates a map we get a working map with our custom data:
You can see how smooth map rendering is because it redraws continuously comparing to traditional web maps where new static tiles are requested as soon user pans or zooms the map.
Interactivity
One of the nice things with client-side rendering is that all geodata is already on a client, including attributes. With just a few lines of code we can allow users click on objects on a map to see attributes:
map.on('click', function(e) {
  map.featuresAt(e.point, {}, function(err, features) {
      if (features && features.length > 0) {
        document.getElementById('feature-info').innerHTML = features[0].properties["ANDAMAL_1T"];
      }
  });
});
For that to work we have to first mark layers that we want to be queryable interactive: true in style.json. Now, by clicking on the building you can see what type of building it is in the lower left corner of the map.
Performance
One of the advantages of using WebGL comparing to other rendering technologies is that it can utilize GPU to perform different tasks and therefore should at least theoretically have much better performance. Below is a demo where you can add 1000 features at a time to the map to test how many features mapbox-gl.js is capable of drawing before browser becomes slow and unresponsive. Warning, this demo may crash your browser!
What you’ll notice is that initial drawing is slow as it takes a couple of seconds before new 1000 features appear on the map. During that time browser can hang and become unresponsive and I guess it has more to do with parsing of huge geojson than the actual drawing. But once parsed and drawn, map remains smooth and you can zoom and pan without lagging. I’ve managed to come up to about 10000 features on Safari, after that browser would usually crash. I’m sure that with more efficient data formats like vector tiles you can handle much bigger amounts of data.
Conclusion
I see two main areas where mapbox-gl.js is different comparing traditional mapping libraries like Leaflet or Openlayers. First, it’s the flexibility it gives us because everything is rendered client side. Having full control of rendering we can create completely new type of applications that are more interactive. Using for instance traffic information roads can be styled differently depending on whether there are traffic jams in the area or not. Another advantage is performance. Now that we can render whole world in the browser there’s no need prerender data into tiles, which once again opens up for building much more interactive and fun to use applications!