From zero to tileserver
Earlier this year Hemnet, Swedish biggest real estate search site, has launched a new map search. I would like to give an insight in how we’ve ended up building our custom tileserver from scratch.
Location is one of the most important factors when buying a house so map is vital part of our site. In fact we serve approximately 80 million pages that have map every month. After thorough research on what would make a great map search experience we landed on the following decisions:
- Our old “small” map showed only 50 search results at a time. The idea behind this was that it would match properties in result list below it(which obviously can’t show thousands of listings).
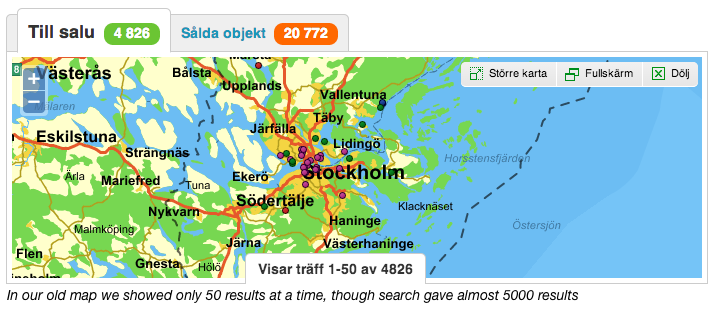
We knew that concept of pagination doesn’t work well with maps so we wanted to show all search results on a map, be it 50 or 10000.
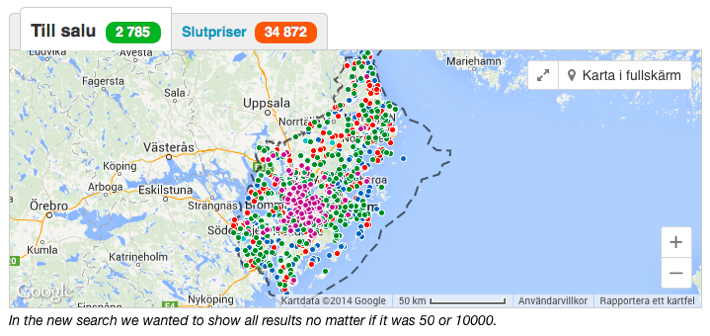
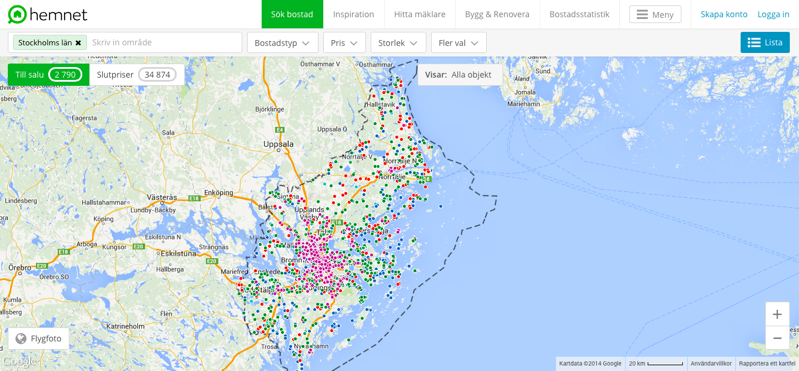
- For users who prefer map view as starting point we would create a fullscreen map that would work great on smartphones, tablets and desktop computers. Of course that would require us to be able to show all search results on a fullscreen map as well.
Lots of data on the map
With those decisions being made we were facing a problem that everyone working with maps stumbles upon sooner or later. Searches can result in anything from couple of properties up to 100000. Drawing so much data in a browser would slow down the page and at worst crush the browser.
One way of walking around this problem is to cluster markers so that number of objects drawn in the browser is so low that even browsers like IE8 can handle it. We did a few tests and realized that while this solution probably works well with some types of data, it sure is a poor solution for real estate data where property’s location is crucial. Clustering would make some areas look like there are no properties for sale out there up until user zooms in a fair bit. We thought that wouldn’t make a great map search experience.
Raster to the rescue
Obvious way to go was to render data as raster images serverside and show them as overlay. We’ve set up a WMS service with Geoserver on top of our PostGIS database. That worked to some extent although we’ve noticed a few problems.
- With about 15 different search criteria how would we tell Geoserver to render tiles matching that search criteria while preserving good performance?
- Sitting on the top of Postgres database, Geoserver would make a database call doing a complex search query for every tile or set of tiles. That means that for every page with a map we would hit database unknown number of extra times. With volume of the traffic that we have it would be very hard to scale our infrastructure to handle so much database load.
- How would we optimize performance if caching tiles is not an option? Properties are published and removed from our site all the time, every single minute.
- We wanted markers to be interactive and of different size depending on how many markers are on the map, not on zoom level.
The best of two worlds
With that in mind we’ve come up with a mixed approach. If user search results in 500 or more properties we would render them with non clickable tiles(no one would want to click on specific point with so many points on a map anyway). Otherwise render bigger fully interactive icons in the browser. Every time user pans or zooms we would check if current viewport has 500 or more properties and choose appropriate render strategy. Initial search would be cached in Redis so those checks would be blazingly fast and never hit database again.
Why 500? Our tests showed that it’s about that number of points that the poorest performant browser that we aim to support is able to render and still maintain good user experience. Up to 500 properties is also a number that about 90% of all searches return.
We did first quick prototype of a tileserver based on node.js and Mapnik through node-mapnik bindings. In the first version Mapnik was reading data from PostGIS datasource. Needless to say, hitting database for every tile made things slow. First performance tests confirmed that scoring just 9 tiles per second.
To have great user experience with this rendering approach, both tiles and requests that decide how to render data had to be fast. Really fast. To achieve that we replaced PostGIS datasource in Mapnik with in memory CSV datasource(CSV had support for lines and polygons as opposed to MemoryDatasource). Our Ruby on Rails application behind hemnet.se would make database search, save it in Redis and when tiles needed to be rendered our tileserver would read data from Redis, create datasource and provide it to Mapnik. That was a big step forward as performance improved drastically.
But there was one problem. A CSV of about 5mb with 60000 points with 3 attributes could take up to 600 MB of memory. As each datasource we would provide to Mapnik represents one unique search and our users make all kinds of different searches, memory consumption would be totally unpredictable.
This is where my colleague told me - “Skrew it, let’s try render tiles without Mapnik!”. I was a bit skeptic at first but we gave it a try. Because our cartography was very simple it was as easy as to pick point that are within bounds of requested tile, translate coordinates to pixels and draw them on a canvas.
Tuning the performance
Results turned out to be great but we still had some optimizations to do. Our goal was to make each tile request last no longer that 50 to 100 milliseconds. With all data being in memory what could possibly take so much time(in some cases up to a couple of seconds per tile)? After some code profiling we found the bottleneck - drawing thousands of points on a canvas was slow. In tiles with many points most of them were unnecessary to draw because they were drawn behind each other anyway.
To avoid that we kept track at what pixel coordinates on a tile a point was already drawn. If a new point was going to be drawn at the same pixel we simply skipped it. The performance boost was huge and we were now pretty close to our goal render time.
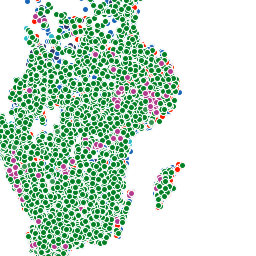 Having full control of rendering was really great as we now could tweak tiny details as we wish. For instance, in tiles like image to the right, we gave higher priority to “more popular” types of properties like villas and apartments and lower priority to types like yards and holiday houses. So if villa and yard were to be drawn at the same pixel, yard would get skipped.
We did a few other tweaks that had to do with infrastructure as we run as many tileserver instances as there are CPU cores available and we had some concurrency issues.
With all optimizations in place we are now capable of rendering few thousands tiles per second in our production environment with most tiles taking about 100-200 ms to render. I think it’s an amazing result considering that it’s all live data that is constantly changing.
End result
As we gradually rolled out our tileserver to the masses, we were very happy with results. Transition between rendering with tiles and rendering in browser was almost seamless. I think we managed to find a sweet spot with solution that can show big amount of constantly changing data while remaining interactive and user friendly. You can give it a try on our fullscreen search page.
In most cases established software like Mapserver or Geoserver are definitely the way to go for maps that need to show lots of data. In cases like ours, when you need tileserver to be tightly integrated with existing infrastructure and scale to millions of users, creating one customized to specific use case can be an option. After all, the solution turned out to be quite simple, although it took some iterations to find right technologies to use.
Here’s a talk I gave about tileserver at FOSS4G 2014 in Portland: